71+ SaaS Statistics, Trends, and Benchmarks for 2026

Software as a service (SaaS) is growing. Innovation, including AI features, extends functionality and growth.
But how big the SaaS industry really is? And what will it look like a couple of years from now? How many SaaS companies are out there? Find out the most recent and important SaaS statistics to help you better understand where SaaS is headed.
SaaS Statistics – Our Top Picks
- The global SaaS market was valued at $273.55 billion in 2023. It’s projected to reach 1,228.87 billion by 2032 at a compound annual growth rate (CAGR) of 18.4%.
- 41% of SaaS companies offer a free plan. 15% of them offer both free plans and free trials of higher-tier accounts. 4% of SaaS companies only have demos and don’t offer free access to their products.
- The average SaaS business loses 18% of its average contract value on discounts.
- 36% of SaaS companies don’t have any in-app guidance. 35% have product tours and 29% do interactive walkthroughs.
- 23% of SaaS applications fall under the productivity and collaboration market segment. Other segments are customer service (16%), marketing (14%), e-commerce (13%), data and analytics (11%), sales (11%), human resources (8%), and finance (5%).
- 56% of SaaS companies plan to progress new AI innovations in 2024.
SaaS Industry Growth Statistics
1. The global SaaS market was valued at $273.55 billion in 2023. SaaS industry trends project the market to reach 1,228.87 billion by 2032 at a compound annual growth rate (CAGR) of 18.4%. SaaS market growth is projected to continue over the next 10 years. The North American SaaS market size was valued at $131.18 billion in 2023.
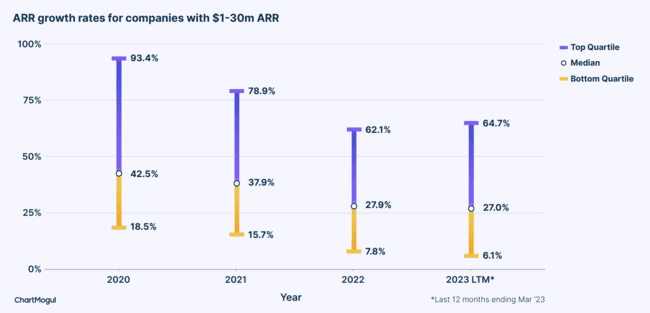
2. The top 25% of SaaS businesses with an annual run rate between $1M and $30M grew 62.1% in 2022. This is slower compared to 2021 where growth was at 78.9%. SaaS growth in 2020 was 93.4%.
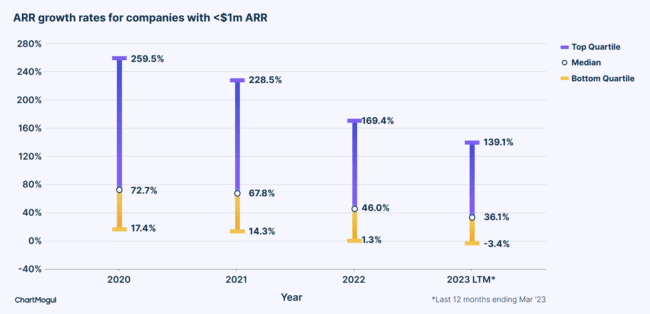
3. SaaS businesses with an annual run rate of $1M and less grew 139.1% from March 2022 to March 2023.
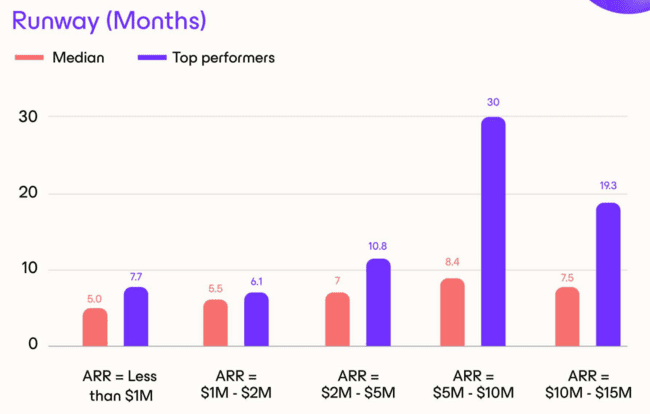
4. A SaaS solution with an ARR of $10M to $15M can only stay in business for 7.5 months (median) based on their current cash reserves. Others: $5M to $10M SaaS revenue (8.4 months), $2M to $5M (7 months), $1M to $2M (5.5 months), less than $1M (5 months).
5. SaaS companies in the United States (47%) are growing faster than European SaaS companies (39%).
6. SaaS companies serving the real estate and construction sector are growing the fastest with a median ARR of 75%. This is followed by SaaS companies serving industrial (55%) and consumer goods and services sectors (52%).
7. 73% of all SaaS businesses were founded after 2010. 93% of SaaS companies didn’t exist before 2000.
SaaS Sales and Marketing Statistics
1. The average B2B SaaS sales cycle length is 134 days. Sales cycles are longer, it was 107 days in the previous period.
2. 84% of B2B SaaS leaders said that decreasing the length of sales cycles is a priority for their organizations.
3. The median customer acquisition cost (CAC) increased 180% between Jan 2021 and June 2023. This means SaaS companies had to spend more money to close the same number of deals.
4. CAC payback, which is the time it takes to recoup the losses generated by acquiring SaaS customers, increased by 150%.
5. 68.6% of SaaS companies increased their average contract value (ACV). 23.2% said their ACV stagnated and 8.2% saw their ACV decline.
6. SaaS companies with declining ACV saw an average decrease of 22%. 44% reported a decline between 10% to 30% and only 7% had a decline of over 50%.
7. The average SaaS company loses 18% of its ACV on discounts.
8. 42% of SaaS organizations saw a decline in average revenue per unit (ARPU). For companies that saw a decline, the average decline was 52%.
9. 81.2% of SaaS companies believe that an inability to offer flexible payment options prevented deals from closing.
10. SaaS companies have to add 16 days on average to their sales cycles to negotiate payment terms.
11. 64.4% of SaaS businesses report that the number of stakeholders involved in each deal increases. 44% added that as many as 4 stakeholders are involved in each deal. 59% said the stakeholders are founders or CEOs.
12. Only 28% of SaaS companies were able to reach 100% to 114% of their targets. Others were only able to hit less than 54% of their goals (3%), 55% to 69% (12%), 70% to 84% (21%), 85% to 99% (29%). 7% could reach 115% or higher.
13. 63% of SaaS companies said they faced significant challenges with their outbound campaigns. 51% struggled with their organic and social campaigns. 49% cited challenges with alliances and partnerships. For 40%, the challenge was paid ads.
14. 53% of SaaS companies increased their sales cycles with 10%.
15. 49% of SaaS companies increased their sales cycle. 32.7% said there was no change and 18.4 said there was a decrease.
SaaS Onboarding Statistics
1. 41% of SaaS companies offer a free plan. 15% of them offer both free plans and free trials of higher-tier accounts. 4% of SaaS companies only have demos and don’t offer free access to their products.
2. 79% of SaaS products have a friction-based signup flow. A friction-based sign-up requires users to enter other details besides their name and email, to confirm their email, or enter a credit card number before they gain access to the product.
3. 54% of SaaS companies use single sign-on (SSO) to remove friction from the signup process. 45% said they don’t. 1% said they use SSO for login but not for signup.
4. 66% of SaaS products have welcome screens. A welcome screen sets expectations for what’s to come and lets them know how to get the most out of the product.
5. 76% of martech SaaS companies will have a micro survey form in their welcome flow to reduce their time to value and increase trial-to-paid conversion rates.
6. 36% of SaaS companies don’t have any in-app guidance. 35% have product tours and 29% do interactive walkthroughs.
7. 56% of SaaS products won’t have any onboarding checklists. 70% don’t have a progress bar.
SaaS and Artificial Intelligence
1. 76% of SaaS companies are currently using or testing AI in their business and 23% are considering use cases.
2. 67% of SaaS businesses now offer AI features in their products.
3. 56% of SaaS companies plan to progress new AI innovations in 2024.
4. 17% of SaaS businesses are testing deep learning AI. 15% have already introduced it to their products. 6% are now testing casual AI for product use and 8% are testing for operational purposes. For more AI stats, check out our article with surprising ChatGPT statistics.
5. 73% of business decision-makers are under pressure to increase their adoption or investments in AI and machine learning. In response, 42% of SaaS vendors are now developing new AI products.
6. 52% of SaaS companies find the uncertainty of future legal frameworks surrounding AI as their biggest challenge. 37% even see this as a major barrier to adopting AI. Other challenges mentioned include potential new security vulnerabilities (37%) not having enough relevant and reliable data (37%), reputational harm (33%), and transparency with users (30%).
SaaS Market Size Statistics
1. North America leads the SaaS market with a 44% global revenue share. One reason for that is the presence of well-established market players. Its developed IT infrastructure also made deploying cloud-based services in the region easier.
2. Salesforce is the largest SaaS company with $31.4 billion in revenue for fiscal year 2023 and over 72K employees. Other top SaaS companies are Google, Microsoft, Adobe Creative Cloud, Intuit, and Stripe.
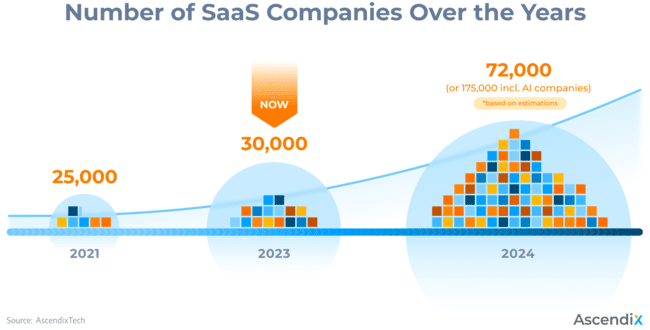
3. There are around 30,000 SaaS companies in the world.
4. The artificial intelligence (AI) SaaS market is forecasted to reach $1.547.57 billion by 2030 with a compound annual growth rate (CAGR) of 37.66% from 2022 to 2030.
SaaS Spending Statistics
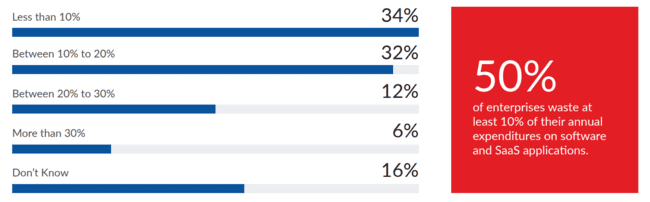
1. 34% of IT decision-makers say less than 10% of their organizations’ total annual spend for licensed applications is spent on unused or mismanaged SaaS apps.
2. IT only controls 27% of SaaS spending. That’s a 35% decrease in control of spending year over year. This is partly due to the increase in end-user spending. More companies are allowing teams and employees to buy the SaaS solutions they need to do their jobs.

3. The average organization has 234 SaaS renewals per year. An organization with more than 10,000 employees will renew 341.3 SaaS tools per year on average.
4. 85% of SaaS vendors plan to invest in improving their security and data privacy credentials. 56% made AI an immediate investment priority. 74% of vendors made integration and APIs their innovation priority.
5. SaaS portfolios increased by 32% between 2021 and 2023 despite tighter budgets and staffing reductions. The average SaaS spend per employee is $9,643.
6. Buying cycles have increased by 37% in 2023. Negotiations make up 54% of the buying cycle.
7. Multi-year agreements are down by 14% for net new purchases and 28% for renewals in 2023 compared to 2021. This is partly due to CFOs prioritizing optionality and shifting back to 12-month agreements.
SaaS Adoption Statistics
1. An organization uses 130 SaaS software on average.

2. A large organization (10,000+ employees) uses an average of 410 apps. Organizations with 200 to 749 employees use 80 apps; 750 to 2,999 use 192 apps; and 3,000 to 9,999 use 152 apps.
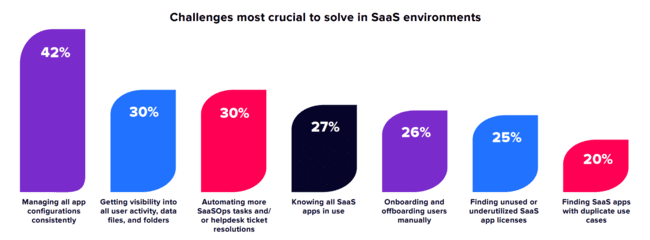
3. 42% of IT and security experts said managing app configurations consistently was the most crucial challenge to solve. Other challenges mentioned were getting visibility into all user activity (30%), automating SaaSOps tasks (30%), knowing all SaaS platforms in use (27%), onboarding and offboarding users manually (26%), finding unused SaaS app licenses (25%), and finding SaaS apps with duplicate use cases (20%).

5. Organizations with 5,000+ employees have fewer workers expensing SaaS apps (only 8% to 10%). But these organizations also have a lower utilization rate (45% to 49%).
6. 23% of SaaS providers fall under the productivity and collaboration market segment. Other segments are customer service (16%), marketing (14%), e-commerce (13%), data and analytics (11%), sales (11%), human resources (8%), and finance (5%).
SaaS Funding Statistics
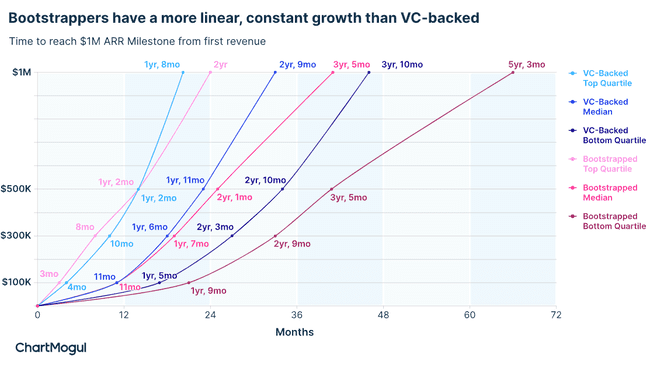
1. The top 25% of bootstrapped SaaS companies reach $1M ARR in 2 years, only 4 months slower than VC-backed SaaS startups.
2. SaaS companies with ARR below $1M are growing at similar rates to larger businesses. Growth for all SaaS companies below $1M ARR has slowed so much that they’re now growing at similar rates to those above $1M ARR. The median ARR growth for bootstrapped SaaS businesses is 14% below $1M ARR and 15% between $1M-$30M ARR.
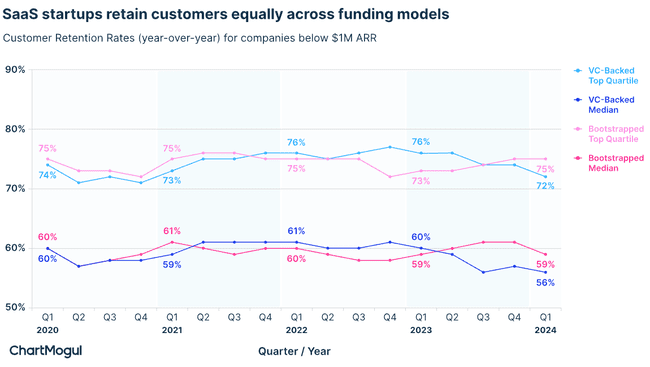
3. Below $1M ARR SaaS startups retain customers equally across funding models. Bootstrapped companies have a slight edge with a 59% customer retention rate, and VC-backed businesses have a 56% CRR.

4. The top 10% of all SaaS companies with $1M-30M ARR consistently achieve net revenue retention of over 100%. VC-backed companies have 105% NRR, while bootstrapped companies have 103%.
5. All SaaS companies with $1M-30M ARR rely more on expansion to drive growth. In the last 4 years, the proportion of ARR from new business for bootstrapped companies went from 67% to 55%. For VC-backed companies, it changed from 58% to 54%. Reactivation has been constant for both, between 10-11%.
6. 43% of SaaS companies self-fund their growth.
7. Equity-backed B2B SaaS companies have a slightly higher net revenue retention (103%) compared to bootstrapped companies (100%). There’s no difference in their gross revenue retention (91%).

8. SaaS companies that are bootstrapped (44%) have a slightly higher growth rate than venture-backed (43%) ones.
Churn Statistics in SaaS
1. 85% of SaaS businesses believe that offering customers more flexible payment options could significantly reduce churn. 24.7% of them believed that the lack of payment flexibility directly caused customer churn.
2. Companies with less than $1M ARR have the highest median logo churn at 2.7%. SaaS companies with $5M to $10M ARR have the lowest, 1.7% logo churn.
3. Organizations leave 40% of their SaaS apps wasted, unused, and ripe for optimization.
SaaS Security Statistics
1. 65% of SaaS apps used in organizations were adopted without the IT department’s knowledge or approval.
2. 37% of organizations said securing SaaS apps is their biggest SaaS challenge.
3. 42% of IT and security experts say securing user activities in SaaS apps is difficult.
4. The top SaaS-related security issue is users adding apps that store sensitive data (43%). Other security concerns include users forwarding work email to personal email (35%), violating security policies (25%), adding unauthorized apps (19%), and sharing sensitive data publicly (19%).
5. 81% of IT and security professionals believe IT is responsible for protecting sensitive data within cloud SaaS apps.
Customer Relationship Management (CRM) SaaS Stats
1. SaaS CRM (Cloud-based CRM) will grow at an estimated compound annual growth rate (CAGR) of 13.43% between 2022 and 2027.
2. Experts expect the size of the CRM market to increase by $59 billion between 2022 and 2027. It’s party caused by the SMEs that adopt cloud SaaS.
3. North America had the largest market share of CRM software in 2022, at 43.6%. This is because several regional enterprises’ increasing adoption of CRM platforms. Here is an overview of CRM platforms in Canada that are the most popular.
4. The Asia Pacific CRM market is the fastest-growing at a CAGR of 15.6%. Countries like China and India will drive the demand for CRM platforms in the region. Find the best CRM software in Australia in our guide including features, pricing, pros, and cons.
You can find more CRM statistics here. If you’re interested in other SaaS niches, check out our collection of email marketing stats, marketing automation statistics, lead generation stats, and website statistics.
We reviewed hundreds of SaaS products at Email Vendor Selection over the years, including big names like Salesforce, Hubspot, and white-label SaaS software. Here’s a short selection of our pieces so you can see how these products perform:
- Hubspot Review
- SMS Marketing Platforms
- Free SMTP Servers
- Ecommerce Platforms
- Landing Page Builders
- Project Management Software
- Email Verification Tools
Sources
SaaS Industry Growth Statistics
1. Fortune Business Insights “Software as a Service (SaaS) Market Size, Share, and COVID-19 Impact Analysis…” June 2023
2-3. ChartMogul “SaaS Benchmarks Report” 2023
4-6. Capchase “The Capchase SaaS Benchmark Report 2023” 2023
7. Vainu “A Global Study of 70,000 SaaS Companies” Aug 2022
SaaS Sales and Marketing Statistics
1-11. Capchase “B2B SaaS Sales Cycles in 2023: New Insights and Data” 2023
12-15. Everstage “The Impact of Economic Downturn on the SaaS Industry“
SaaS Onboarding Statistics
1-7. Userpilot “State of SaaS Onboarding 2023“
SaaS and Artificial Intelligence
1-6. Panintelligence “AI Value or Vanity? How SaaS Companies Are Approaching Innovation” 2023
SaaS Market Size Statistics
1. Grand View Research “Software As A Service (SaaS) Market Size, Share & Trends Analysis…”
2. CloudZero “Best Of The Best: 99+ Top SaaS Companies To Know In 2024”
3. Ascendix “How Many SaaS Companies Are There in the World” May 2023
4. Verified Market Research ” Global Artificial Intelligence SaaS Market Size…” Sept 2022
SaaS Spending Statistics
1. Oomnitza “2023 Snapshot Survey: SaaS and Cloud Spend Optimization and Automation” 2023
2-3. Zylo “2022 SaaS Management Index Report“
4. Panintelligence “AI Value or Vanity? How SaaS Companies Are Approaching Innovation” 2023
5. Productiv “2023 State of SaaS“
6-7. Vendr “The SaaS Trends Report Q3: 2023“
SaaS Adoption Statistics
1-4. BetterCloud “2023 State of SaaSOps“
5. Zylo “2022 SaaS Management Index Report”
6. Vainu “A Global Study of 70,000 SaaS Companies” Aug 2022
SaaS Funding And IPO Statistics
1-5. ChartMogul “SaaS Growth Report”
6. River SaaS Capital “2022 SaaS Industry Report“
7. SaaS Capital Insights “2023 B2B SaaS Retention Benchmarks” 2023
8. Capchase “The Capchase SaaS Benchmark Report 2023” 2023
Churn Statistics in SaaS
1. Capchase “B2B SaaS Sales Cycles in 2023: New Insights and Data” 2023
2. Capchase “The Capchase SaaS Benchmark Report 2023” 2023
3. Zylo “2022 SaaS Management Index Report”
SaaS Security Statistics
1-5. BetterCloud “2023 State of SaaSOps”
Customer Relationship Management (CRM) SaaS Statistics
1-2. Technavio “SaaS Customer Relationship Management (CRM) Market by End-user, Application, and Geography – Forecast and Analysis 2023-2027” Dec 2022
3-5. Grand View Research “Customer Relationship Management Market Size, Share, & Trends Analysis Report… 2023 to 2030”